The First Wall: Why the Database Bottleneck Hits First
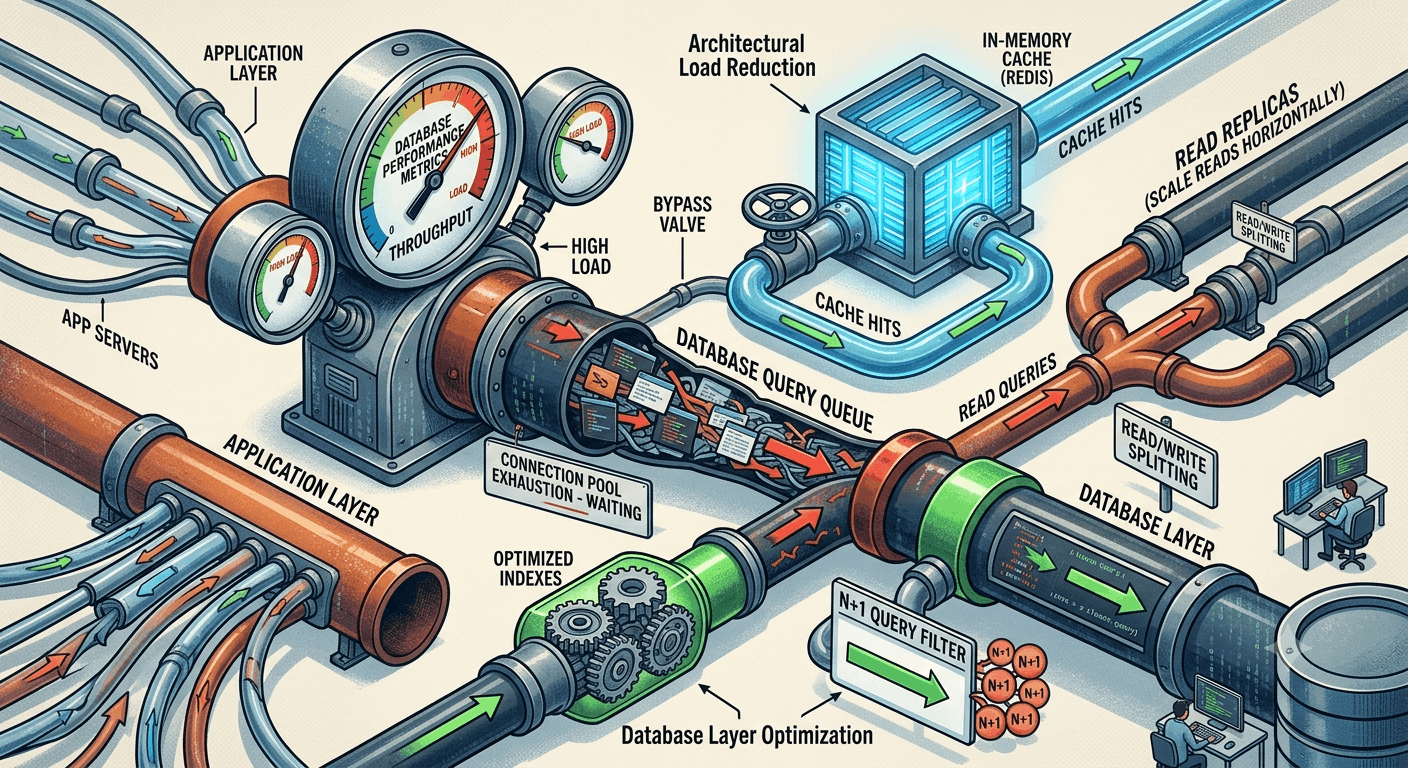
Every growing web application eventually hits a performance wall, and in over 80% of architecture lifecycles, that wall is the database layer.
When traffic increases, application servers (like Node.js, Go, or Python workers) are stateless and trivial to scale horizontally behind a load balancer. The database layer, however, carries state, enforces ACID guarantees, manages disk I/O, and maintains lock mechanisms across shared tables.
The initial symptoms of a database bottleneck follow a predictable progression:
Connection Pool Exhaustion: Application instances spend up to 10–20MB of memory per database connection. Under heavy load, requests stall simply waiting for an open socket.
CPU & I/O Wait Spikes: A single unindexed query scanning millions of rows saturates CPU cores and thrashes disk storage IOPS.
Lock Contention: High-frequency write updates create cascading lock waits, blocking concurrent read operations.
Phase 1: In-Place Database Layer Optimization
Before introducing external architectural complexity, optimize the primary database to extract its maximum potential.
1. Query & Index Optimization
Inefficient queries are the single largest source of database degradation. A missing index can force full table scans, turning a 2ms query into a 5-second lock-holder.
Analyze Query Execution Plans: Run EXPLAIN ANALYZE (PostgreSQL) or EXPLAIN FORMAT=JSON (MySQL) to identify sequential scans, expensive temporary sorts, and un-indexed joins.
Target High-Selectivity Columns: Create indexes on columns frequently present in WHERE, JOIN, and ORDER BY clauses. Avoid indexing low-cardinality fields (like gender or boolean flags).
Leverage Composite & Partial Indexes: For multi-column conditions, place the most selective filter first. Use partial indexes for active subsets (e.g., WHERE status = 'active') to keep index sizes light in memory.
Eliminate SELECT *: Querying unneeded columns bloats memory consumption and prevents index-only scans.
2. Eliminating the N+1 Query Antipattern
The N+1 problem occurs when an Object-Relational Mapper (ORM) executes 1 initial query to fetch parent records, followed by N separate queries to fetch associated children.
SQL-- Bad: Executing 1 query for users, then N queries for their ordersSELECT*FROM users WHERE active =true; SELECT*FROM orders WHERE user_id =1; SELECT*FROM orders WHERE user_id =2; -- ...repeated N times-- Optimized: A single explicit JOIN or eager load batch querySELECT users.id, orders.id, orders.total FROM users INNERJOIN orders ON users.id = orders.user_id WHERE users.active =true;
3. Connection Pooling
Creating and tearing down TCP connections with authentication overhead consumes excessive CPU and memory on the database host.
Deploy a dedicated middleman connection pooler—such as PgBouncer (in transaction mode) for PostgreSQL or ProxySQL for MySQL. Multiplexing hundreds of application worker connections into a small, highly optimized pool of 20–30 persistent database connections drastically drops memory overhead.
Phase 2: Architectural Offloading & Load Reduction
Once query optimization and connection pooling are in place, the next objective is reducing the direct query load reaching your primary database.
Client Requests │ ▼ ┌───────────┐ ┌──────────────┐ │ Application│ ──────▶│ Redis Cache │ (Handles ~80-90% of reads) └─────┬─────┘ Cache Miss└──────────────┘ │ ├─── Reads ────▶ ┌──────────────┐ │ │ Read Replicas│ (Scale read volume horizontally) │ └──────────────┘ │ └── Writes ────▶ ┌──────────────┐ │ Primary DB │ (Sole authority for transactional writes) └──────────────┘
1. In-Memory Caching (Cache-Aside Strategy)
For read-heavy workloads (which represent the majority of web applications), an in-memory key-value store like Redis or Memcached drastically cuts database hits.
Cache-Aside Pattern: The application checks Redis first. On a cache hit, data returns instantly in sub-milliseconds. On a cache miss, data is read from the database, written to Redis with a strict Time-to-Live (TTL), and returned.
Cache Invalidation: Use TTL combined with explicit event-driven invalidation (or versioned key tags) when data mutates to prevent serving stale state.
2. Read Replicas (Read/Write Splitting)
If your application executes intensive analytical or aggregate queries alongside transaction writes, route them away from the primary instance.
Configure asynchronous replication to one or more Read Replicas.
Update application drivers to send write operations (INSERT, UPDATE, DELETE) to the Primary DB and send read queries (SELECT) across replica endpoints.
Note: Account for replication lag—reads issued immediately after a write should hit the primary database to avoid presenting stale data to the user.
3. Asynchronous Writes via Message Queues
Heavy write paths (such as logging user activity, updating analytics counters, or sending notifications) do not need to be processed synchronously in the critical path of an HTTP request.
Pass these events to a message queue (e.g., RabbitMQ, Apache Kafka, AWS SQS) and process them with worker queues that batch write operations into the database.
Phase 3: Advanced Architectural Scaling
When a single primary database can no longer sustain write operations or store the total volume of data on disk, advanced structural strategies are required.
| Strategy | Description | Best Use Case | Operational Complexity |
| Table Partitioning | Splitting large tables logically by range (e.g., date ranges) on the same instance. | Massively growing time-series or log data. | Medium |
| Denormalization | Selectively duplicating data across tables to minimize expensive runtime joins. | High-traffic search or dashboard endpoints. | Medium |
| Horizontal Sharding | Partitioning data across multiple independent database nodes using a shard key. | Datasets exceeding single-server disk/RAM physical limits. | High (Last Resort) |
shopping_bag Recommended Resources
Enjoyed this article?
Follow us for more tech insights, agency updates and digital trends.